React.js App Instrumentation
Follow the steps below to auto-instrument your React.js web app. When completed, your app will appear in the Cardinal Service Catalog, and Chip will begin monitoring it.
- Install the OpenTelemetry dependencies:
npm install --save @opentelemetry/instrumentation
npm install --save @opentelemetry/auto-instrumentations-web
npm install --save @opentelemetry/sdk-trace-web
npm install --save @opentelemetry/context-zone
npm install --save @opentelemetry/resources
npm install --save @opentelemetry/semantic-conventions
npm install --save @opentelemetry/exporter-trace-otlp-http- Initialize the instrumentation:
If your application has signed-in user state, we recommend initializing the instrumentation when the user profile is available, so that user information is included in fetch spans.
Here's an example:
import { getWebAutoInstrumentations } from '@opentelemetry/auto-instrumentations-web';
import { ZoneContextManager } from '@opentelemetry/context-zone';
import { OTLPTraceExporter } from '@opentelemetry/exporter-trace-otlp-http';
import { registerInstrumentations } from '@opentelemetry/instrumentation';
import { resourceFromAttributes } from '@opentelemetry/resources';
import {
  BatchSpanProcessor,
  WebTracerProvider,
} from '@opentelemetry/sdk-trace-web';
import { ATTR_SERVICE_NAME } from '@opentelemetry/semantic-conventions';

// Enable OpenTelemetry Web instrumentation, and add user attributes
// to `fetch` spans
useEffect(() => {
  if (userProfile) {
    const resource = resourceFromAttributes({
      [ATTR_SERVICE_NAME]: 'your-service-name',
      'deployment.environment.name': 'local', // local/dev/staging/prod
    });

    const tracerProvider = new WebTracerProvider({
      resource,
      spanProcessors: [
        new BatchSpanProcessor(
          new OTLPTraceExporter({
            url: window.location.origin + '/otlp/v1/traces', // See Step 3 below
          }),
        ),
      ],
    });
    tracerProvider.register({
      contextManager: new ZoneContextManager(),
    });

    registerInstrumentations({
      tracerProvider,
      instrumentations: [
        getWebAutoInstrumentations({
          '@opentelemetry/instrumentation-user-interaction': {
            enabled: false,
          },
          '@opentelemetry/instrumentation-document-load': {
            enabled: false,
          },
          '@opentelemetry/instrumentation-fetch': {
            enabled: true,
            semconvStabilityOptIn: 'http',
            ignoreNetworkEvents: true,
            applyCustomAttributesOnSpan(span) {
              span.setAttribute('user.email', userProfile.email);
              span.setAttribute('user.id', userProfile.userId);
            },
          },
        }),
      ],
    });
  }
}, [userProfile]);- Set up a backend endpoint to proxy (receive and forward) traces – this ensures that you're not exposing your Cardinal API key in your browser app.
Here's an example of an Express (opens in a new tab) route handler to do this:
app.post('/otlp/v1/traces', async (req, res) => {
  try {
    const otlpEndpoint = process.env.OTEL_EXPORTER_OTLP_ENDPOINT;
    if (!!otlpEndpoint) {
      const response = await fetch(otlpEndpoint + '/v1/traces', {
        method: 'POST',
        body: JSON.stringify(req.body),
        headers: {
            'Content-Type': 'application/json',
            'x-cardinalhq-api-key': process.env.CARDINALHQ_API_KEY,
        },
      });
      return res.status(response.status).send();
    }
    return res.status(200).send();
  } catch (err) {
    logger.error(err, 'Error proxying web traces');
    // Handle error
  }
});
Set these environment variables:
export OTEL_EXPORTER_OTLP_ENDPOINT="https://otelhttp.intake.us-east-2.aws.cardinalhq.io"
export CARDINALHQ_API_KEY="your-api-key" # Set your API key
To get an API key, sign in to your Cardinal account, and create a new API key from the Organization Settings > API Keys section.
- Run your application:
npm run start # Or your application's start script- Validate that Cardinal is receiving data:
Exercise the app by opening some pages that make fetch HTTP calls. Wait for a few minutes, then visit the Service Catalog in the Cardinal UI to check that your service appears in the list.
PostHog Integration
Use PostHog (opens in a new tab) for session replay recordings?
Update the applyCustomAttributesOnSpan function in your browser instrumentation code above to add a posthog.session_replay_url attribute to spans:
import { usePostHog } from 'posthog-js/react';
const postHog = usePostHog();
// In your `useEffect` hook from above...
applyCustomAttributesOnSpan(span) {
// ... user attributes
span.setAttribute(
'posthog.session_replay_url',
postHog.get_session_replay_url({
withTimestamp: true,
timestampLookBack: 30,
}),
);
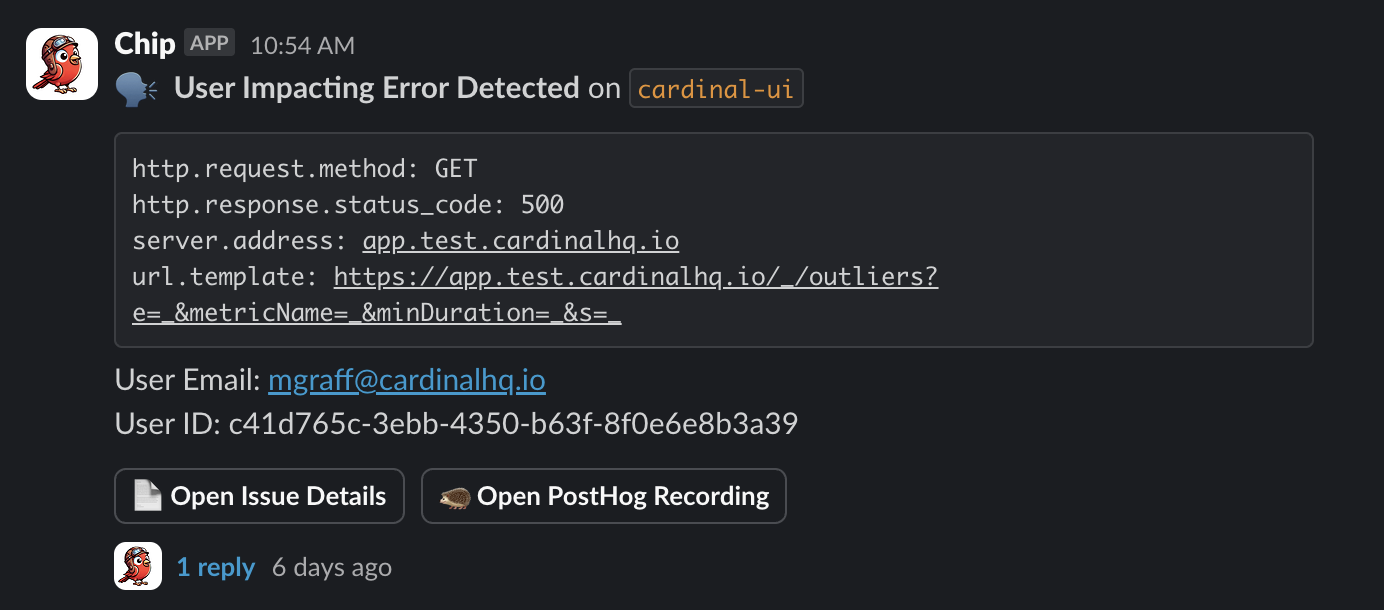
},Now, when Chip detects a user-impacting error, it will helpfully include a link to the relevant PostHog session recording right in the Slack notification: