Exporting Proxmox VE Built-In Metrics over OTLP
Proxmox VE 9 can push the stats it already collects — node, guest, and storage metrics from pvestatd — straight to an OTLP endpoint, with no agent to install. You configure it once at the datacenter level and every node in the cluster starts exporting.
This is the fastest way to get Proxmox metrics into Cardinal (or any OTLP/HTTP receiver). It does not cover Ceph per-daemon metrics or logs — for those, see Shipping Proxmox & Ceph telemetry with a per-node OTel Collector. The two are complementary and can run at the same time.
Prerequisites
Sys.Modify on / (the root@pam account has it).:443; a self-hosted collector is usually :4318.Installation
Find your endpoint and API key
If you are using Cardinal SaaS, log in to app.cardinalhq.io and go to Organization → Integrations → Lakerunner. That page shows the OTLP endpoint for your region and your API key.
For the us-east-2 region the endpoint is:
otelhttp.intake.us-east-2.aws.cardinalhq.ioIf you are not using Cardinal SaaS, point this at any collector with an OTLP/HTTP receiver — your own gateway collector, a vendor endpoint, or a self-hosted Cardinal Data Lake. Everything else in this guide is the same; only the server, port, and headers change.
Open Datacenter → Metric Server
In the Proxmox web UI, select Datacenter in the tree, then Metric Server in the left-hand menu. Metric servers are cluster-wide — you configure this once, not per node.
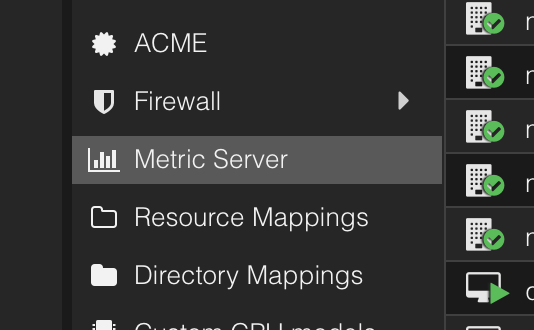
Click Add and choose OpenTelemetry.
Configure the OpenTelemetry server
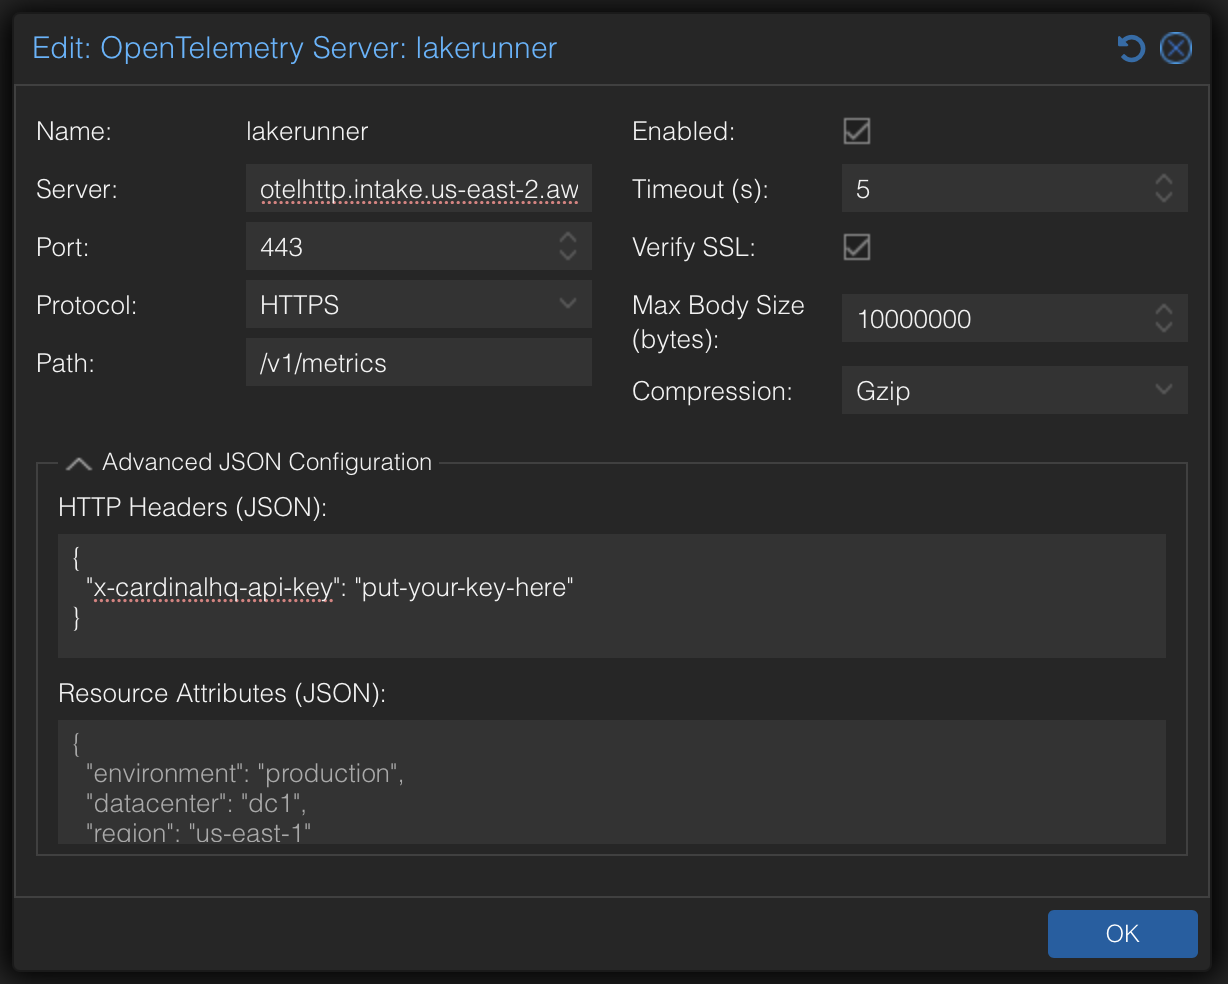
| Field | Value |
|---|---|
| Name | Any label, e.g. lakerunner. Local to Proxmox. |
| Server | otelhttp.intake.us-east-2.aws.cardinalhq.io — hostname only, no scheme and no path. |
| Port | 443 for Cardinal SaaS (4318 for a typical self-hosted collector). |
| Protocol | HTTPS. |
| Path | /v1/metrics — required. Proxmox posts to exactly the path you enter and does not append the OTLP one for you; leave it blank and every export 404s. |
| Enabled | Checked. |
| Timeout (s) | 5 is fine. Raise it only if you see timeouts in pvestatd logs. |
| Verify SSL | Checked. Leave it on for any public endpoint; only uncheck for an internal collector with a self-signed certificate. |
| Max Body Size (bytes) | 10000000 (the default). |
| Compression | Gzip. |
Expand Advanced JSON Configuration and set the authentication header. For Cardinal, the key from step 1 goes in x-cardinalhq-api-key:
{
  "x-cardinalhq-api-key": "put-your-key-here"
}
Other destinations use their own header — e.g. {"Authorization": "Bearer <token>"}. A collector that does not authenticate needs no headers at all.
Resource Attributes (JSON) is optional but worth filling in: these are stamped onto every exported metric and are how you tell clusters apart downstream. Without these, multiple clusters will look like one in the dashboards and metrics.
{
  "deployment.environment.name": "production",
  "proxmox.cluster.name": "my-cluster"
}
Click OK. Each node’s pvestatd picks up the new metric server within one stats interval — no restart needed.
Confirm metrics are flowing
Export failures are logged by pvestatd on the node that hit them:
journalctl -u pvestatd -n 50 --no-pagerSilence is success. A misconfigured server shows up here immediately — for example a missing or wrong Path logs an HTTP 404 from the endpoint, and a bad key logs a 401.
On the destination side, look for metrics tagged with the resource attributes you set in the previous step. Every node in the cluster should report, not just the one you were logged into when you added the server.
What’s collected
This exports the same data set that drives Proxmox’s own summary graphs, gathered by pvestatd on each node at the cluster stats interval:
- Node — CPU load and utilization, memory and swap usage, root filesystem usage, network throughput, uptime.
- Guests — per-VM and per-container CPU, memory, disk, and network counters, for every guest on the node.
- Storage — per-storage used and total bytes for each configured storage.
Each node exports its own metrics independently, so losing one node does not interrupt the rest.
What it does not collect: logs of any kind, Ceph per-daemon performance counters, and the detailed OTel system.* host metrics. Add the per-node collector alongside this if you need them.
Troubleshooting
| Symptom | Likely cause |
|---|---|
Nothing arrives, pvestatd logs a 404 | Path is empty or wrong. It must be /v1/metrics; Proxmox does not append it. |
pvestatd logs a 401 or 403 | Header name or API key wrong. Cardinal expects x-cardinalhq-api-key, spelled exactly, in the HTTP Headers JSON. |
| TLS handshake or certificate errors | Endpoint is HTTP-only, or an internal collector is using a certificate the node does not trust. Fix the trust store, or uncheck Verify SSL for internal endpoints only. |
| Export timeouts under load | Raise Timeout, or lower Max Body Size so each POST is smaller. |
| Metrics from only one node | Metric servers are datacenter-wide, so this is a per-node network problem — check outbound HTTPS from the nodes that are missing. |
| No OpenTelemetry option in the Add menu | The node is running Proxmox VE 8 or earlier. Use the per-node collector guide. |
Reach out to support@cardinalhq.io for support or to ask questions not answered in our documentation.