Interlinks
Interlinks turn dashboards into reusable investigation paths. When you right-click a chart series or bar, Cardinal shows the useful next places to investigate and carries the selected entity and time range into the destination dashboard.
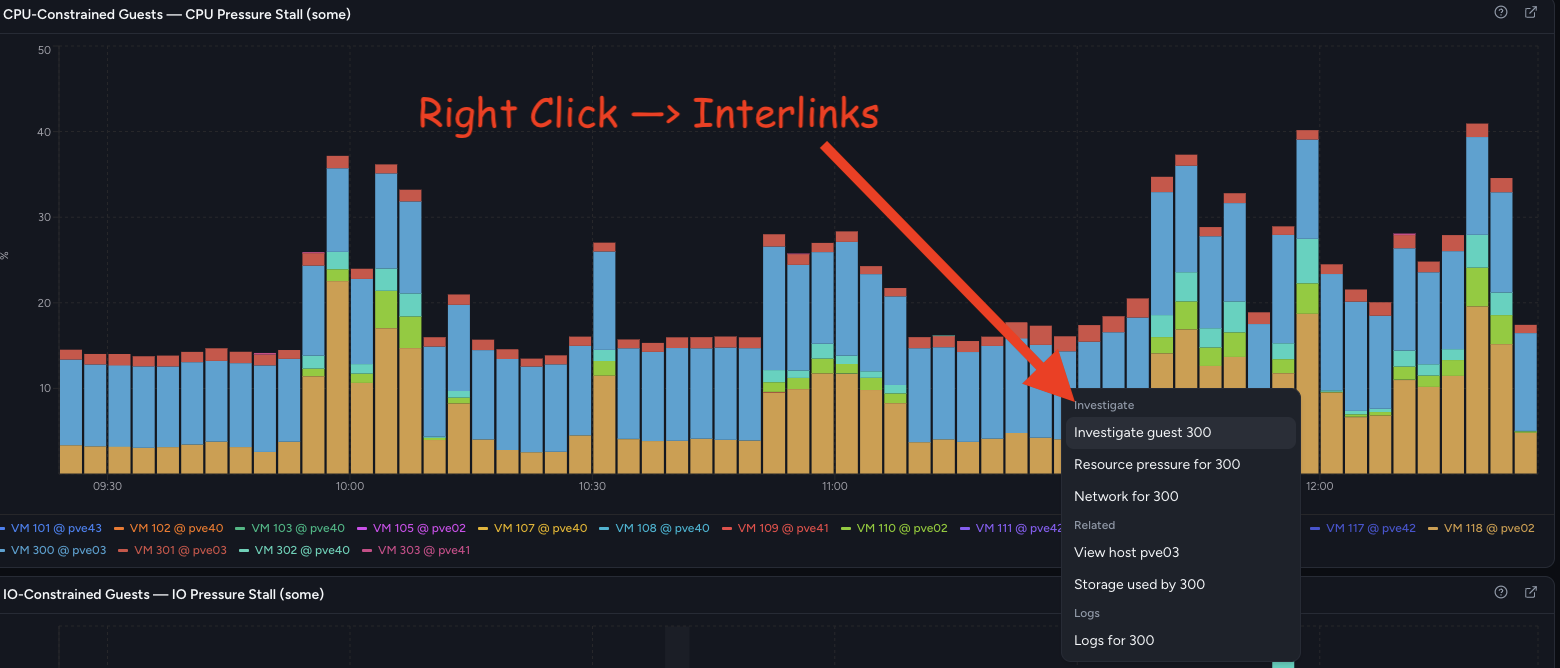
Follow an Interlink
- Open a dashboard and find the entity or series you want to investigate.
- Right-click the series or bar to open its Interlinks menu.
- Choose a path under Investigate, Related, or Logs.
- Cardinal opens the destination dashboard with the relevant variables and time range already set.
Only paths that apply to the selected data are shown. For example, a CPU-constrained virtual machine can link to its resource pressure, network, storage, underlying host, and logs views.
Context across dashboards
An Interlink defines both a destination and the context needed to open it:
- the labels that must be present on the selected series;
- how source labels map to variables on the destination dashboard; and
- whether to keep the current time range.
The mapping is explicit, so the source and destination do not need to use the same label names. A source label such as vmid, for example, can populate a destination variable with a completely different name.
Shared investigation knowledge
Interlinks encode more than navigation. Together, they describe how to move from a symptom to the next useful question. Humans and Cardinal agents can follow the same paths, and agents can leave useful new Interlinks behind for later investigations.
Because these paths are visible on the dashboard, operators can inspect and vet the routes an agent will take. Dashboards become shared troubleshooting knowledge: a visual, reviewable map that humans and agents can improve together.