Extracting Metrics from Log Telemetry
Overview
This rule type allows you to derive new metrics directly from your existing log telemetry. By applying this configuration, you can:
- Identify numeric fields within your logs and transform them into metrics.
- Define the metric type (e.g., Counter, Gauge).
- Assign a custom name, unit, and optional conditions for when to extract the metric.
- Add dimensions (labels) derived from other attributes in the logs, enabling richer and more meaningful metric data.
This is particularly useful if you want to build metrics out of textual log data, turning raw events into quantitative insights for observability, alerting, or performance tracking.
What Does This Rule Do?
When enabled, the rule inspects incoming logs and extracts metric values based on user-defined rules and patterns. For example, you can:
- Convert a log field that tracks the size of a payload into a Gauge metric.
- Transform a count of a certain type of error occurrence into a Counter metric.
- Attach additional dimensions (key/value pairs) from other log fields to enrich the metric context.
Key Features
-
Multiple Metric Types: Choose between
CounterorGaugemetrics. -
Counter: Used for values that increase monotonically (e.g., number of requests processed).
-
Gauge: Used for values that can go up or down (e.g., current number of running processes).
-
Metric Name & Unit: Assign a human-readable name and optional unit (e.g.,
"requests_per_second"or"cpu_usage_percentage"). -
Customizable Metric Value: Select which field in your logs will serve as the numeric value for the metric.
-
If
Counteris chosen and no numeric fields are found, only Counter is available. -
If
Gaugeis selected, you must specify a numeric field to represent the gauge’s value. -
Conditional Logic: Add conditions to restrict when a metric is extracted. For example, only create the metric if a certain attribute or field matches a given value.
-
Dimensions (Labels): Add one or more dimensions to the metric. Dimensions are key/value pairs that add context (e.g.,
service.name = "checkout",host.region = "us-east-1"). You define a dimension name (the metric label key) and choose which log field to extract the dimension value from.
Options and Parameters
Example:
Metric Type
- Counter: Incrementing metric. Use this if your chosen log field represents a running total (e.g., number of occurrences).
- Gauge: Value can go up or down. Use this for values like memory usage, temperature readings, or response time measurements.
(If no numeric fields are detected in the logs, only the Counter option will be shown.)
Metric Name
A required, descriptive name for your metric. This name will appear in metric queries, dashboards, and alerts.
Metric Unit
An optional field that specifies the metric unit (e.g., seconds, bytes, requests). Including a unit helps provide clarity and context when visualizing or alerting on the metric.
Metric Value
Specify which numeric field from the log will represent the metric’s value. If the metric is a Gauge, this field is required. For Counters, it’s strongly recommended to pick a meaningful numeric field to increment.
Conditions
Add conditions to limit when metrics are extracted. Conditions let you filter by attribute values in the log. For example, if you only want to create a metric for logs originating from a certain host or containing a particular error code, you can configure conditions accordingly.
Each condition compares a specified field against a value you provide. Only logs meeting these conditions will produce the metric.
Dimensions
Add dimensions (also known as labels or tags) to your metric. Each dimension consists of:
- Metric dimension name (key): A string that represents the label name in the metric.
- Dimension value (extracted from a log field): The value for that label, chosen from a list of available log attributes.
Dimensions help you break down and filter metrics in queries, making it easier to analyze data by categories such as host, service, or environment.
You can add multiple dimensions. Each dimension adds a label key and value pair to the metric, enhancing the analytics you can perform.
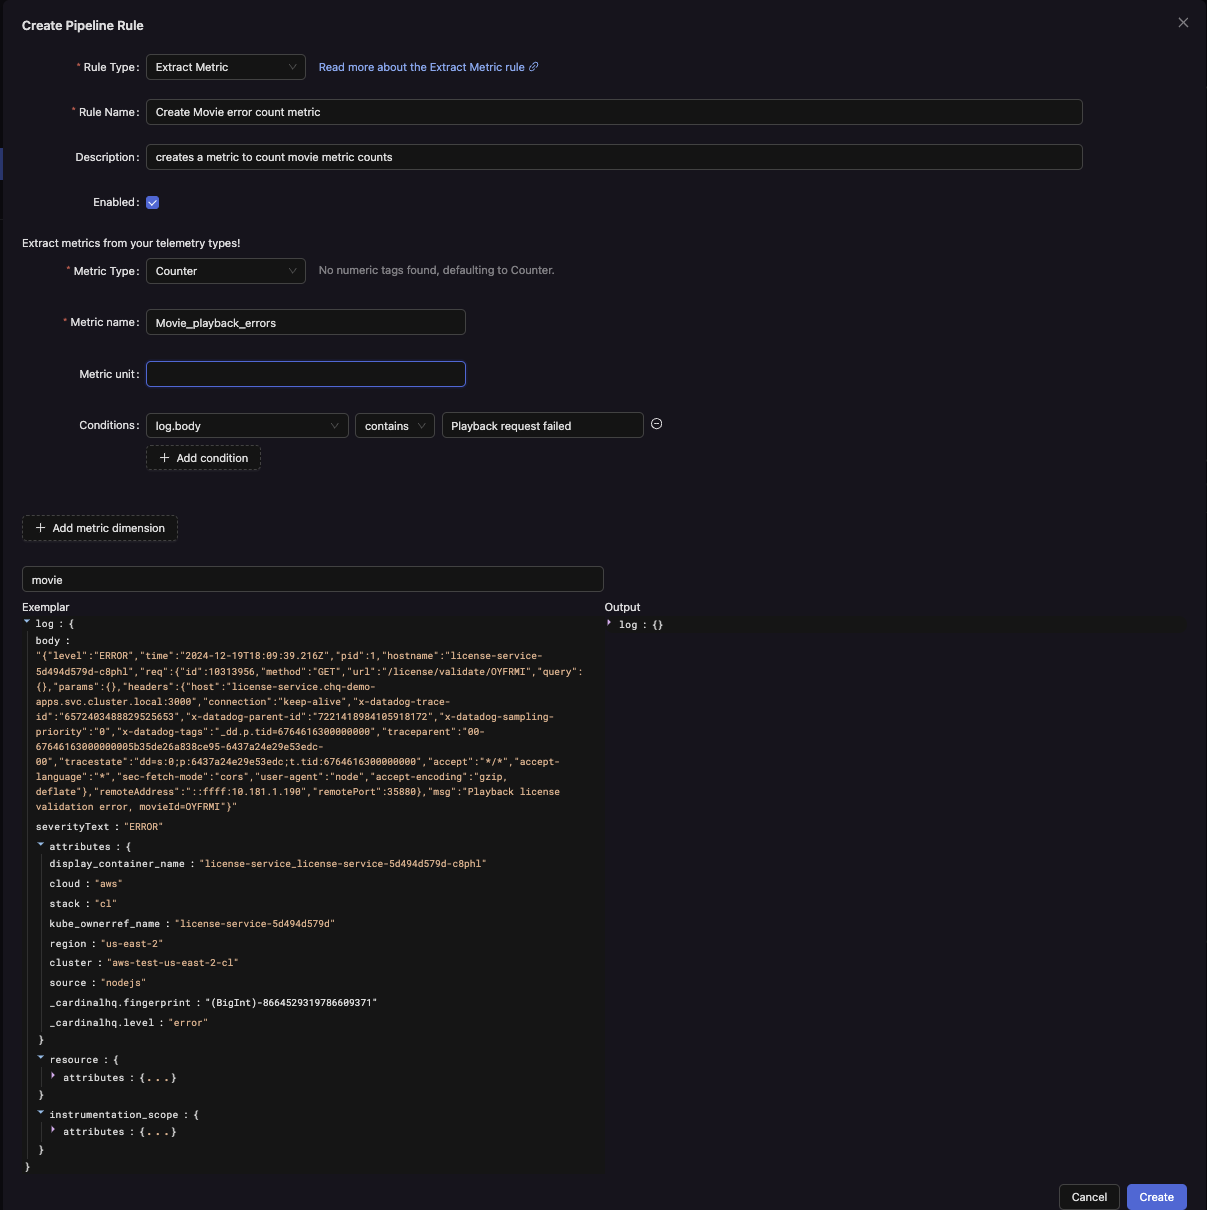
Example Configuration
Goal:
Turn a log field representing request latency into a Gauge metric called request_latency with dimensions for service_name and http_method. Only extract the metric if status_code equals 200.
Configuration Steps:
-
Metric Type: Set
Metric Typeto Gauge. -
Metric Name: Set
Metric nametorequest_latency. -
Metric Unit (optional): Set
Metric unittoms(milliseconds). -
Metric Value: Choose the numeric field from your logs that contains the latency value, e.g.,
attributes.latency_ms. -
Conditions: Add a condition so that metrics are only extracted if
status_code = "200". -
Dimensions:
- Add a dimension named
service_nameand select the log fieldattributes.service. - Add another dimension named
http_methodand select the log fieldattributes.method.
With this configuration, each log entry that meets the condition (status_code = "200") will result in a Gauge metric named request_latency with a value taken from latency_ms, labeled with service_name and http_method.
Summary
By configuring an Extract Metric rule for log telemetry, you can dynamically generate metrics from raw log data. This enables a metric-based approach to monitoring and analysis, improving observability and driving more informed operational decisions. With flexible metric types, names, conditions, and dimensions, you have fine-grained control over how you transform logs into actionable metrics.