Rule Telemetry
When you configure Rules in CardinalHQ (such as masking, filtering, or custom OTTL transformations), each rule continuously generates metrics describing how often it’s evaluated, whether its conditions matched, how long execution took, and if any errors occurred. By examining these Rule Telemetry metrics, you can quickly understand a rule’s impact on your data pipeline and troubleshoot issues with your transformations.
How It Works
As your Managed Collector processes telemetry, each rule emits metrics prefixed with ottl_*. These metrics are then ingested into the CardinalHQ platform, where you can visualize them in the Explore interface or see them directly in the rule details. Common fields include:
metric.rule_id: Uniquely identifies which rule produced the telemetry.metric.version: Indicates the specific version of that rule (especially important if you’ve edited a rule over time).metric.conditions_matched: A boolean (trueorfalse) indicating whether the rule’s conditions matched a given piece of telemetry.
Key Metrics
1. Processed with Matching Conditions
_name: “ottl_rules_processed”
metric.rule_id: a779bcb5-87c4-403e-8825-4d3157eb5adb
metric.conditions_matched: true
metric.version: 1
Description
Shows how many times a rule’s conditions evaluated to true and the rule’s statements were executed. Summing or graphing this metric over time reveals how often the rule actively modifies or filters your data.
2. Processed without Matching Conditions
_name: “ottl_rules_processed”
metric.rule_id: 4456e3b4-ec3e-4d34-bb9f-4498caba7c4c
metric.conditions_matched: false
metric.version: 1
Description Indicates how many times a rule was evaluated but did not meet its conditions. A high number of non-matches can help you refine conditions to ensure you’re targeting the right subset of data.
3. Evaluation Time
_name: “ottl_rule_eval_time”
metric.rule_id: d9f20d83-3326-4ebf-9b20-1aaf21ab33d4
metric.version: 1
Description Captures the time the collector spent evaluating the rule (often recorded as a histogram). If you see unusually high evaluation times, consider optimizing your rule logic or reducing complexity to avoid potential performance bottlenecks.
4. Evaluation Errors
_name: “ottl_rule_eval_errors”
metric.rule_id: bb4fed4c-88bb-4fb6-8ed0-8eecd80cc0d9
metric.version: 1
Description Tally of any errors encountered when evaluating or applying the rule. Persistent or increasing error counts may indicate issues in your expressions, references to attributes that don’t exist, or other logic problems.
Use Cases & Benefits
- Confirm Rule Effectiveness: Track how often a rule’s conditions are met (and thus how often it’s taking action on your data).
- Performance Monitoring: Detect if certain rules are consistently running slowly (high
ottl_rule_eval_time) and optimize them to avoid collector overhead. - Troubleshoot Failures: Identify misconfigured rules by checking for spikes in
ottl_rule_eval_errors. Quickly pinpoint the root cause and fix the logic. - Version Control: Because each metric is tagged with
metric.version, you can easily compare the performance or match rate of different rule revisions over time.
Viewing Rule Telemetry
1. Pipeline View in the Cardinal UI
-
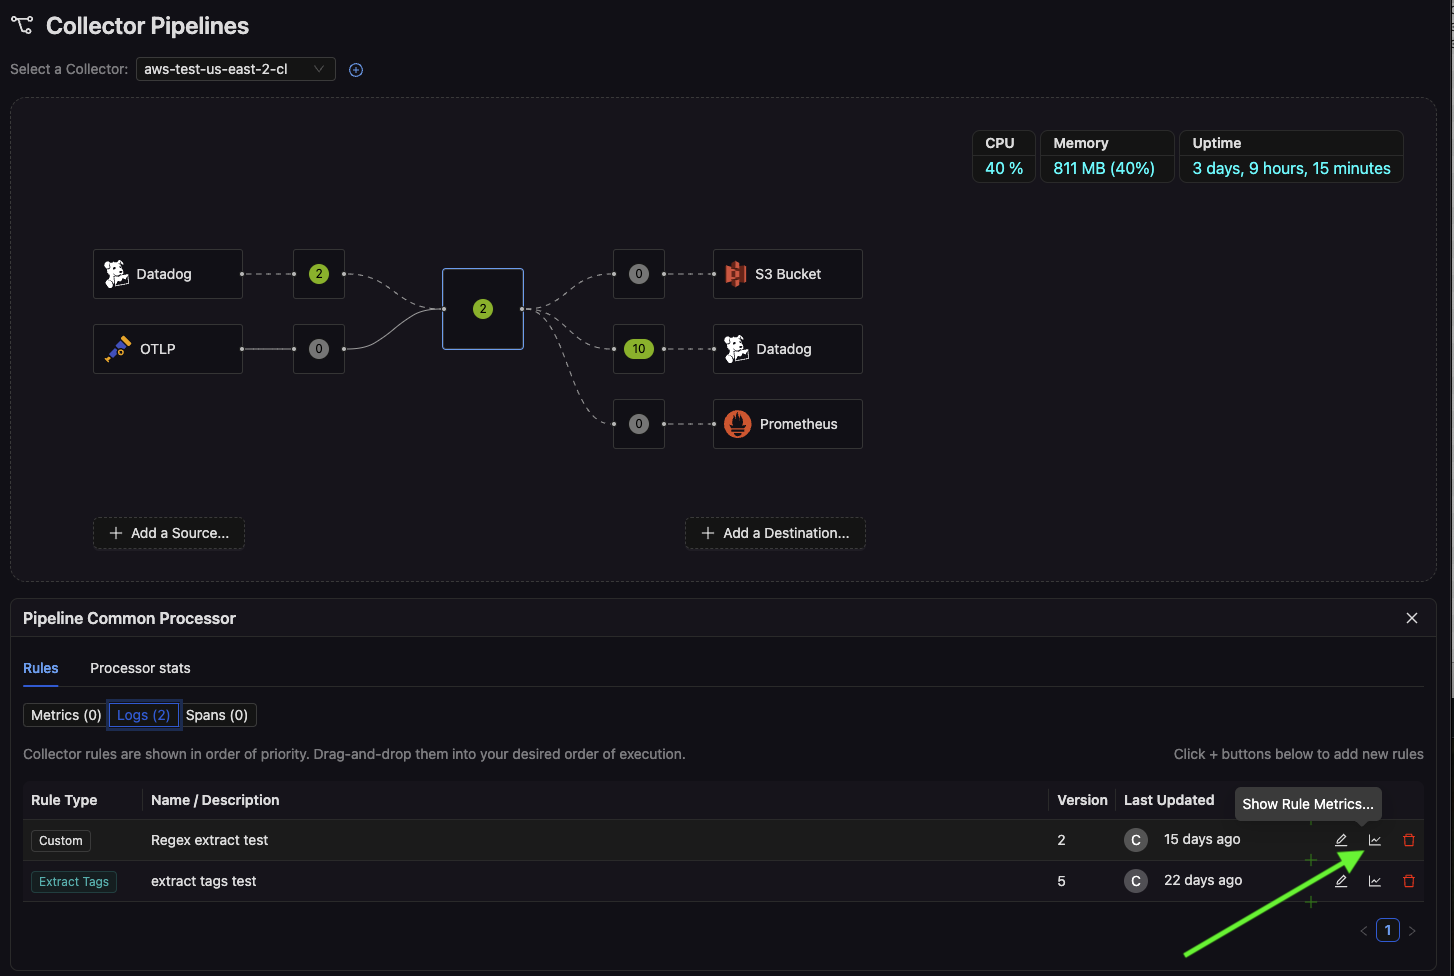
Open the Collector Pipelines page. In the pipeline diagram, locate the processor node that you want to inspect. This node contains the list of rules that apply to your telemetry data.
-
Reveal the Rules list. Click on the telemetry type in the processor section to see all configured rules. You’ll notice the Rule Type, Name/Description, Version, and actions to edit or delete each rule.
-
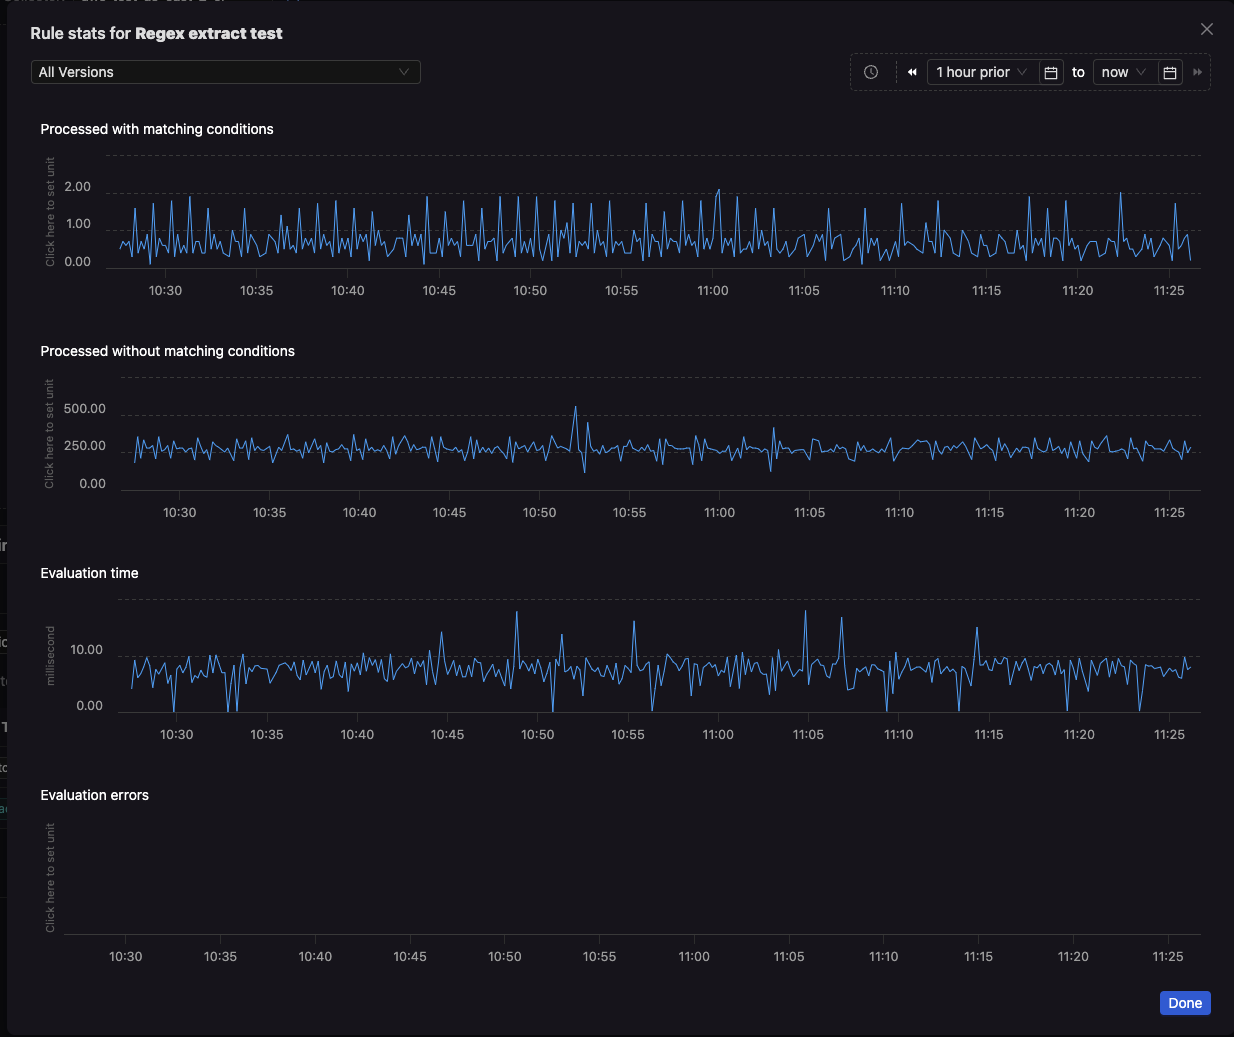
Click the Graph Icon (“Show Rule Metrics”). On the right side of each rule, look for a graph icon or a “Show Rule Metrics” button. Selecting this option opens a dialog with real-time charts for:
- Processed with matching conditions
- Processed without matching conditions
- Evaluation time
- Evaluation errors
This dialog (as shown) provides an immediate, rule-level view of how often conditions match, whether there are errors, and how long the rule spends processing data.
2. Explore Interface
- Filter by
_nameto select one of the relevant metrics (e.g.,ottl_rules_processed). - Narrow the results to a specific rule via
metric.rule_id=<ruleId>. - Target a particular version using
metric.version=<version>if you want to see how a rule’s performance has changed over time.
Best Practices
- Establish a Baseline: Observe typical
ottl_rules_processedcounts and evaluation times for each rule. Any significant deviation from these baselines could indicate changes in data volume or rule complexity. - Regularly Check Errors: Even a small rise in
ottl_rule_eval_errorscan signal a misconfiguration or data schema change. - Use Versions: Increment rule versions when making changes. This helps you compare new and old logic, ensuring improvements actually benefit your pipeline.
By leveraging Rule Telemetry, you gain full visibility into how your transformations, filters, and enrichments operate within your data pipeline—enabling swift, data-driven optimizations and reliable operational control over your CardinalHQ Managed Collectors.