Managed Collector Health Metrics
Our Managed Collectors report their operational health as metrics, making it easy to track metrics such as CPU usage, memory consumption, and uptime directly in the Cardinal UI (opens in a new tab). You can identify these collector-specific metrics by looking for:
- Metric Names beginning with
k8s.*(e.g.,k8s.container.cpu_limit_utilization,k8s.container.memory_limit_utilization) etc. - Tags enable you to filter to your particular collector eg.
metric.cardinalhq.stats_collector_name = <collector_name>This tag indicates the particular Managed Collector you’re viewing.
Health Metrics Overview
Examples of common Managed Collector metrics include:
-
CPU Usage
k8s.container.cpu_limit_utilization: The percentage of the container’s CPU limit currently in use. -
Memory Usage
k8s.container.memory_limit_utilization: The percentage of the container’s memory limit currently in use.container.memory.usage: The total memory the container is actively consuming. -
Uptime
k8s.pod.uptime: How long the pod has been running since it was started or restarted.
These metrics provide crucial insight into how well your collector’s container is performing under its assigned workload.
Viewing Metrics in the Cardinal UI
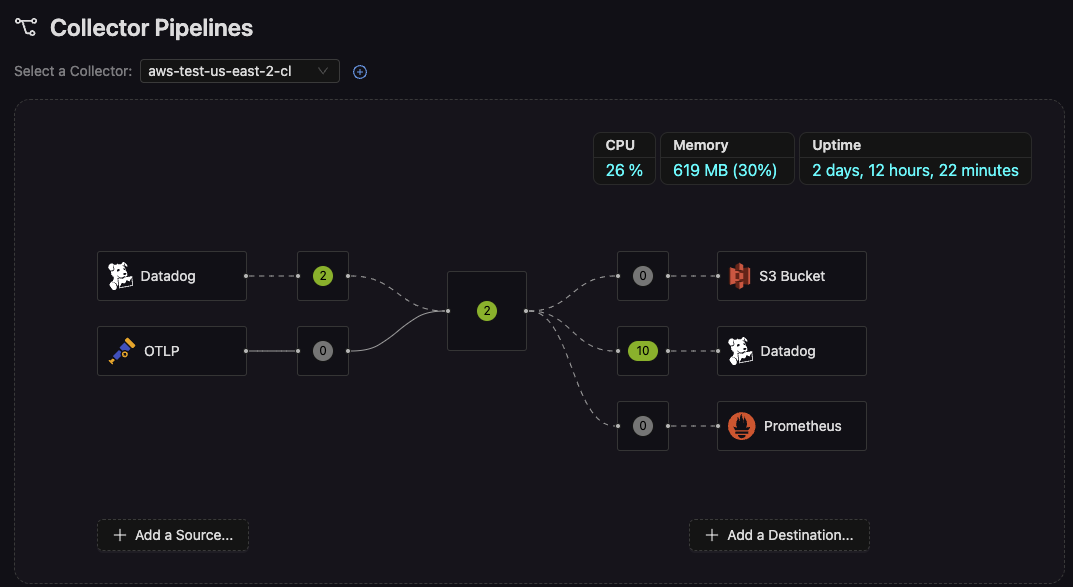
- Pipeline Overview In the Collector Pipelines view, you’ll see a snapshot of CPU, Memory, and Uptime for each collector. This high-level overview helps you quickly identify any collectors nearing resource limits or showing signs of instability.
- Detailed Metrics Exploration By switching to the Explore you can:
- Filter: Focus on a specific collector using the tag
metric.cardinalhq.stats_collector_name = <collector_name>- Query & Visualize: Search for the relevant metric names (e.g.,
k8s.container.cpu_limit_utilization) to graph them over time. - Combine & Compare: Correlate these container metrics with other system metrics or business KPIs to get a holistic view of collector performance.
Why Monitor These Health Metrics?
- Resource Optimization: Spot high CPU or memory usage and adjust resource allocations or rules before the collector becomes a bottleneck.
- Stability & Reliability: Quickly see if collectors have restarted (via uptime) or if memory usage spikes might lead to crashes.
- Proactive Troubleshooting: Historical data helps you pinpoint when usage patterns changed, aiding faster root-cause analysis.
- Capacity Planning: Identify long-term trends to decide whether to increase resources, deploy additional collectors, or redistribute workloads.
By tracking these container-level metrics, you gain the clarity needed to keep your Managed Collectors running smoothly and efficiently, ensuring reliable observability for your entire system.