Source and Destination Telemetry
Within each Managed Pipeline, CardinalHQ provides telemetry metrics that show how data flows through Sources (receivers) and Destinations (exporters). By examining these metrics, you can quickly see how many data points were accepted or refused at a given source, as well as how many were successfully sent or failed at a destination. This ensures transparency into every step of your pipeline, enabling fast troubleshooting and optimization.
Source (Receiver) Metrics
Each source that receives telemetry data—whether logs, metrics, or traces—emits metrics prefixed with otelcol_receiver_. The key metrics are:
- Accepted Count:
otelcol_receiver_accepted_metric_pointsotelcol_receiver_accepted_log_recordsotelcol_receiver_accepted_spans
These show how many items (metrics, logs, or spans) the receiver successfully accepted.
- Refused Count:
otelcol_receiver_refused_metric_pointsotelcol_receiver_refused_log_recordsotelcol_receiver_refused_spans
These show how many items were refused. Refusals might indicate malformed data, unsupported formats, or capacity constraints.
Example
A source named my-receiver might display:
- Accepted logs:
otelcol_receiver_accepted_log_recordswith the tagmetric.receiver=my-receiver. - Refused logs:
otelcol_receiver_refused_log_recordswith the tagmetric.receiver=my-receiver.
By summing or graphing these metrics, you can track the volume of successfully ingested data and identify potential drops or refusals.
Destination (Exporter) Metrics
Each destination, such as a third-party monitoring tool or storage backend, is represented by metrics prefixed with otelcol_exporter_. These metrics indicate how many data items the exporter processed and whether any failed to send:
- Sent Count:
otelcol_exporter_sent_metric_pointsotelcol_exporter_sent_log_recordsotelcol_exporter_sent_spans
These show how many items were sent to the destination successfully.
- Send Failed Count:
otelcol_exporter_send_failed_metric_pointsotelcol_exporter_send_failed_log_recordsotelcol_exporter_send_failed_spans
These show how many items could not be delivered (e.g., due to network or authentication issues, downstream rate limits, etc.).
Example
If you have a destination named datadog-exporter, you might see:
- Sent metrics:
otelcol_exporter_sent_metric_pointswith the tagmetric.exporter=datadog-exporter. - Send failed logs:
otelcol_exporter_send_failed_log_recordswith the tagmetric.exporter=datadog-exporter.
Tracking these metrics helps you validate that data is reaching its destination and identify any failure patterns.
Viewing Source and Destination Metrics
You can view these metrics in two ways:
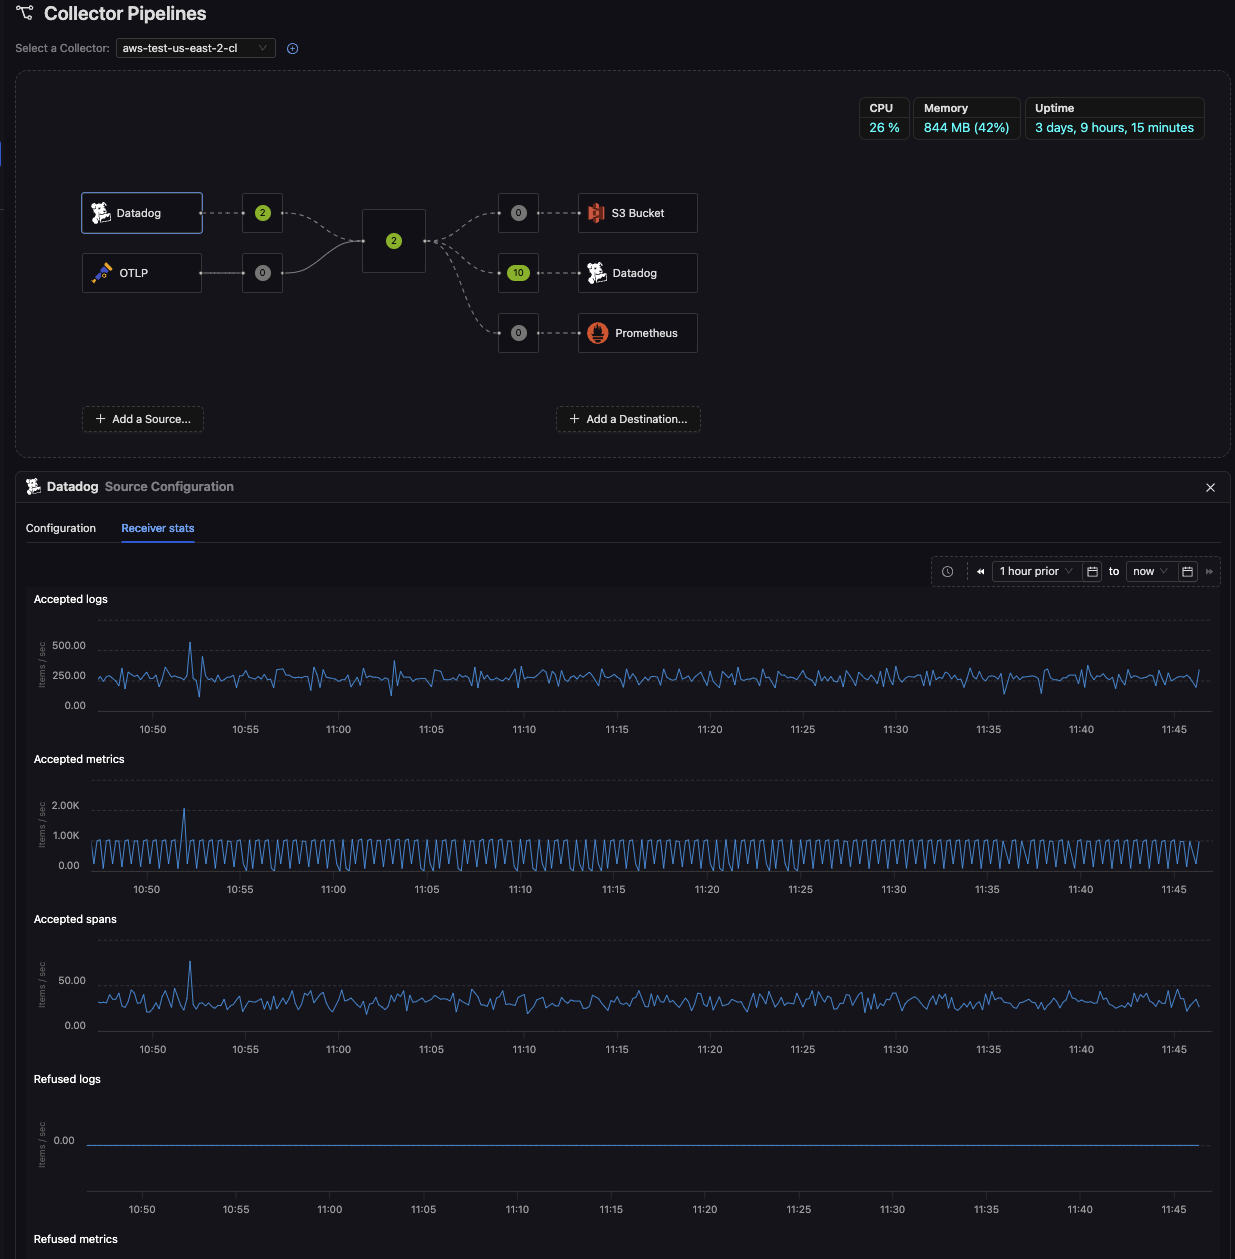
- Pipeline View
- Open the Collector Pipelines page to see a graphical representation of your sources and destinations.
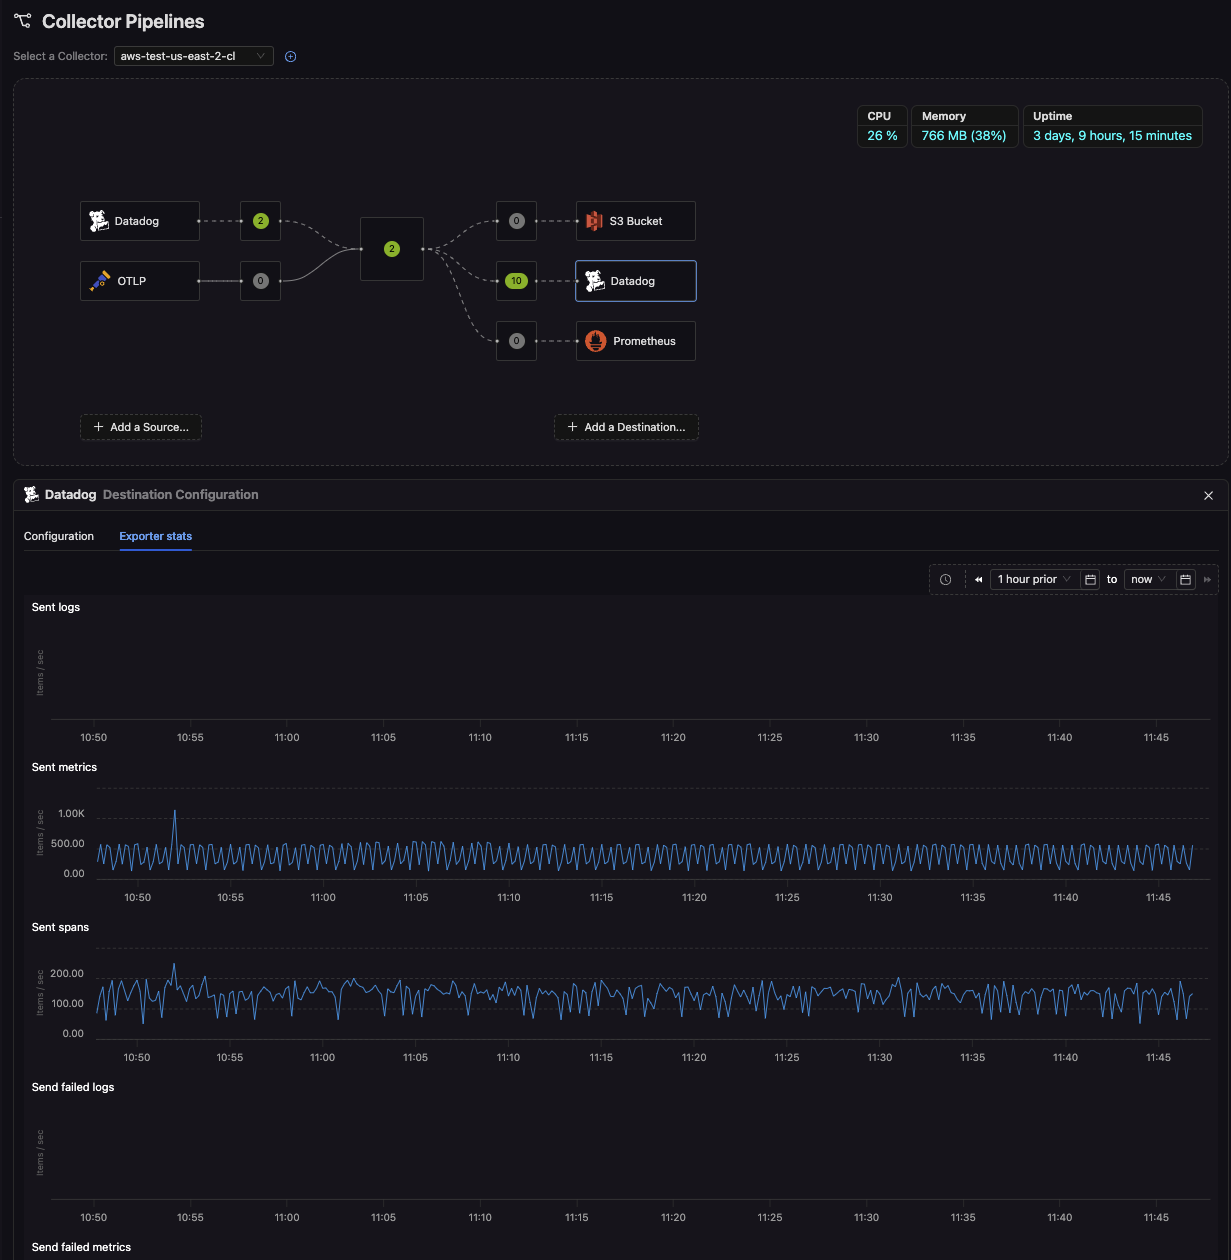
- Click on a source node to view its “Receiver stats” tab, or click on a destination node to view its “Exporter stats” tab.
- You’ll see real-time charts showing how many logs, metrics, or spans were accepted, refused, sent, or failed to send, giving you immediate insights without leaving the pipeline diagram.
Receiver
Exporter
- Explore Section
- Navigate to the Explore interface in CardinalHQ.
- Filter by
_cardinalhq.name(e.g.,otelcol_receiver_accepted_log_records) or by the relevant tags (metric.receiver=<receiver_name>ormetric.exporter=<exporter_name>). - Chart these metrics over time to see acceptance/refusal rates, or sent/failed counts.
This dual approach helps you both drill into details in the Explore interface and quickly assess source/destination performance in context within the pipeline view.
Integrating These Metrics
All these source and destination metrics appear as time-series data in the CardinalHQ platform, labeled with the relevant metric.receiver or metric.exporter tags. This makes it easy to:
- Filter by source or destination to isolate the metrics you care about.
- Chart how many data items were accepted vs. refused or sent vs. failed, over time.
- Investigate any anomalies or sudden spikes in failures, refusals, or changes in throughput.
Why Monitor Source and Destination Metrics?
- Troubleshooting: Quickly pinpoint if data drops are happening at the source (refused) or if messages fail to transmit at the destination.
- Performance Tuning: Watch for throughput bottlenecks—if a destination is seeing high failure rates, investigate network or quota issues.
- Data Integrity: Confirm that the volume of data accepted matches the volume leaving your pipeline, ensuring no silent losses.
- Capacity & Cost Management: Identify underutilized or overloaded parts of your pipeline to adjust resources or optimize usage of third-party tools.
By leveraging source and destination metrics alongside collector health metrics, you gain end-to-end visibility into how data flows through your Managed Pipeline. This visibility is crucial for maintaining a robust, efficient observability stack—ensuring that you capture all valuable data while identifying and fixing issues at any point in the pipeline.